Addressing the issue of difference at school - [Master's thesis]
To build a more inclusive society, discover an effective way to create a culture of tolerance.
Publish at April 19 2016 Updated July 21 2026


When we talk about data, we tend to focus mainly on the possibilities opened up by its widespread use and analysis.
Sometimes, the potential is so great that we forget to mention the more practical aspects of the process: how, exactly, is a learning tracking tool implemented in a classroom?
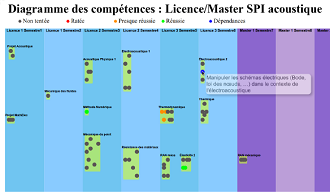
A case study presented at the most recent French Acoustics Conference details the implementation of an online visualization tool—a “skills graph”—in a bachelor’s-to-master’s program at the University of Maine… and the respective reactions of faculty, students, and academic administrators.
In this type of graph, each skill is represented by a point.
A module is therefore represented by a cluster of points—a group of several skills located close together. Hovering over a module displays the academic advisor’s contact information; clicking on it takes you to a page featuring either a lecture or tutorial slide or an assessment example.
The color of the point indicates the level of mastery of a skill (not tested, partially validated, etc.).
The skills graph, called the “coat of arms,” allows each student to have “a clearer picture of the path ahead, what is expected of them, and how they compare to the rest of their class.”
A key principle of this case study is transparency: all information is visible to everyone—faculty and students alike.
On the faculty side, levels of involvement vary. The pilot was launched in early December 2015 within a community of about sixty faculty members, on a voluntary basis.
Three months later, 57 skills are represented in the graph, with 30% of teachers participating.
Participants’ feedback focused primarily on the distribution of competencies across courses: some teachers seemed surprised by the competencies targeted by their colleagues, viewing them as related to their own fields.
The visualization tool highlights potential redundancies and promotes greater alignment across courses.
On the students’ side, the striking aspect is their acceptance—without any particular hesitation—of the fact that everyone can view their personal graph.
Students say they are ready to use it but have many questions about how teachers will use it: the possibility of making up for unvalidated skills, and pedagogical adjustments in the event that not all students validate a skill. Many wonder about the link between grades and skills.
On the “administrators’” side, the benefits of the graph are emphasized: a clearer illustration of the connections between different modules, the possibility of “à la carte” training, with access to resources and deferred support for those who need it.
They are also considering the possibility of more easily translating a degree into a list of competencies, which would facilitate dialogue with the socio-professional world.
Time remains the crucial factor. The efficiency-to-investment ratio must be high, as documenting competencies remains an additional task on top of the grading system.
Like any educational innovation, this skills-mapping experiment depends on support from administrative bodies, which will—or will not—foster the institutionalization and dissemination of these practices... as the authors of the article hope, within a network for exchange among programs that have undertaken similar initiatives.
J. Génevaux, B. Brouard, A. Pelat. Implementation of a L1-M2 Skills Graph in Acoustics and Mechanics at a University. 2016 French Acoustics Conference ( April 2016). https://hal.archives-ouvertes.fr/hal-01291304
You might also like:
Addressing the issue of difference at school - [Master's thesis]
To build a more inclusive society, discover an effective way to create a culture of tolerance.
Complex and chronic traumas [Thesis].
The complex and chronic psychotraumatic dimension can be a blind spot in certain therapeutic approaches. EMDR, a method recognized for its ability to treat trauma by soliciting the body's self-healing capacities, was reformulated in this research to fully integrate the specificities of the complex psychotraumatology of dissociative patients.
Relationship to others and self-evaluation bias in the school environment [Thesis]
It's hard to measure the gap between what we think is true and what is true. This is even more pronounced when it comes to ourselves. This gap, between our self-assessment of our skills and our actual skills, is at the heart of the work presented in this article by Ludivine Jamain, who investigated the biases of students' self-assessment of their skills in French and Mathematics.
Education policies and public opinion (Report)
Promising educational policies may be abandoned in the face of hostile opinion. Others can be helped by more precise communication of their rationale. This report explores the dynamics of public opinion in relation to educational policies, and provides us with a few keys to understanding the context of a reform.
Listening and watching reading [Thesis].
The uses and practices of current readings aloud in a French context, and their ancient sources. Public readings simultaneously solicit the eye and the ear in a being-together. "In a public reading, silence is the foundation of the voice."